Why Choose dot dot dash?
Open Source Freedom
Built on transparency and community-driven innovation.
Self-Service Simplicity
From executives to interns, everyone can create stunning visualizations.
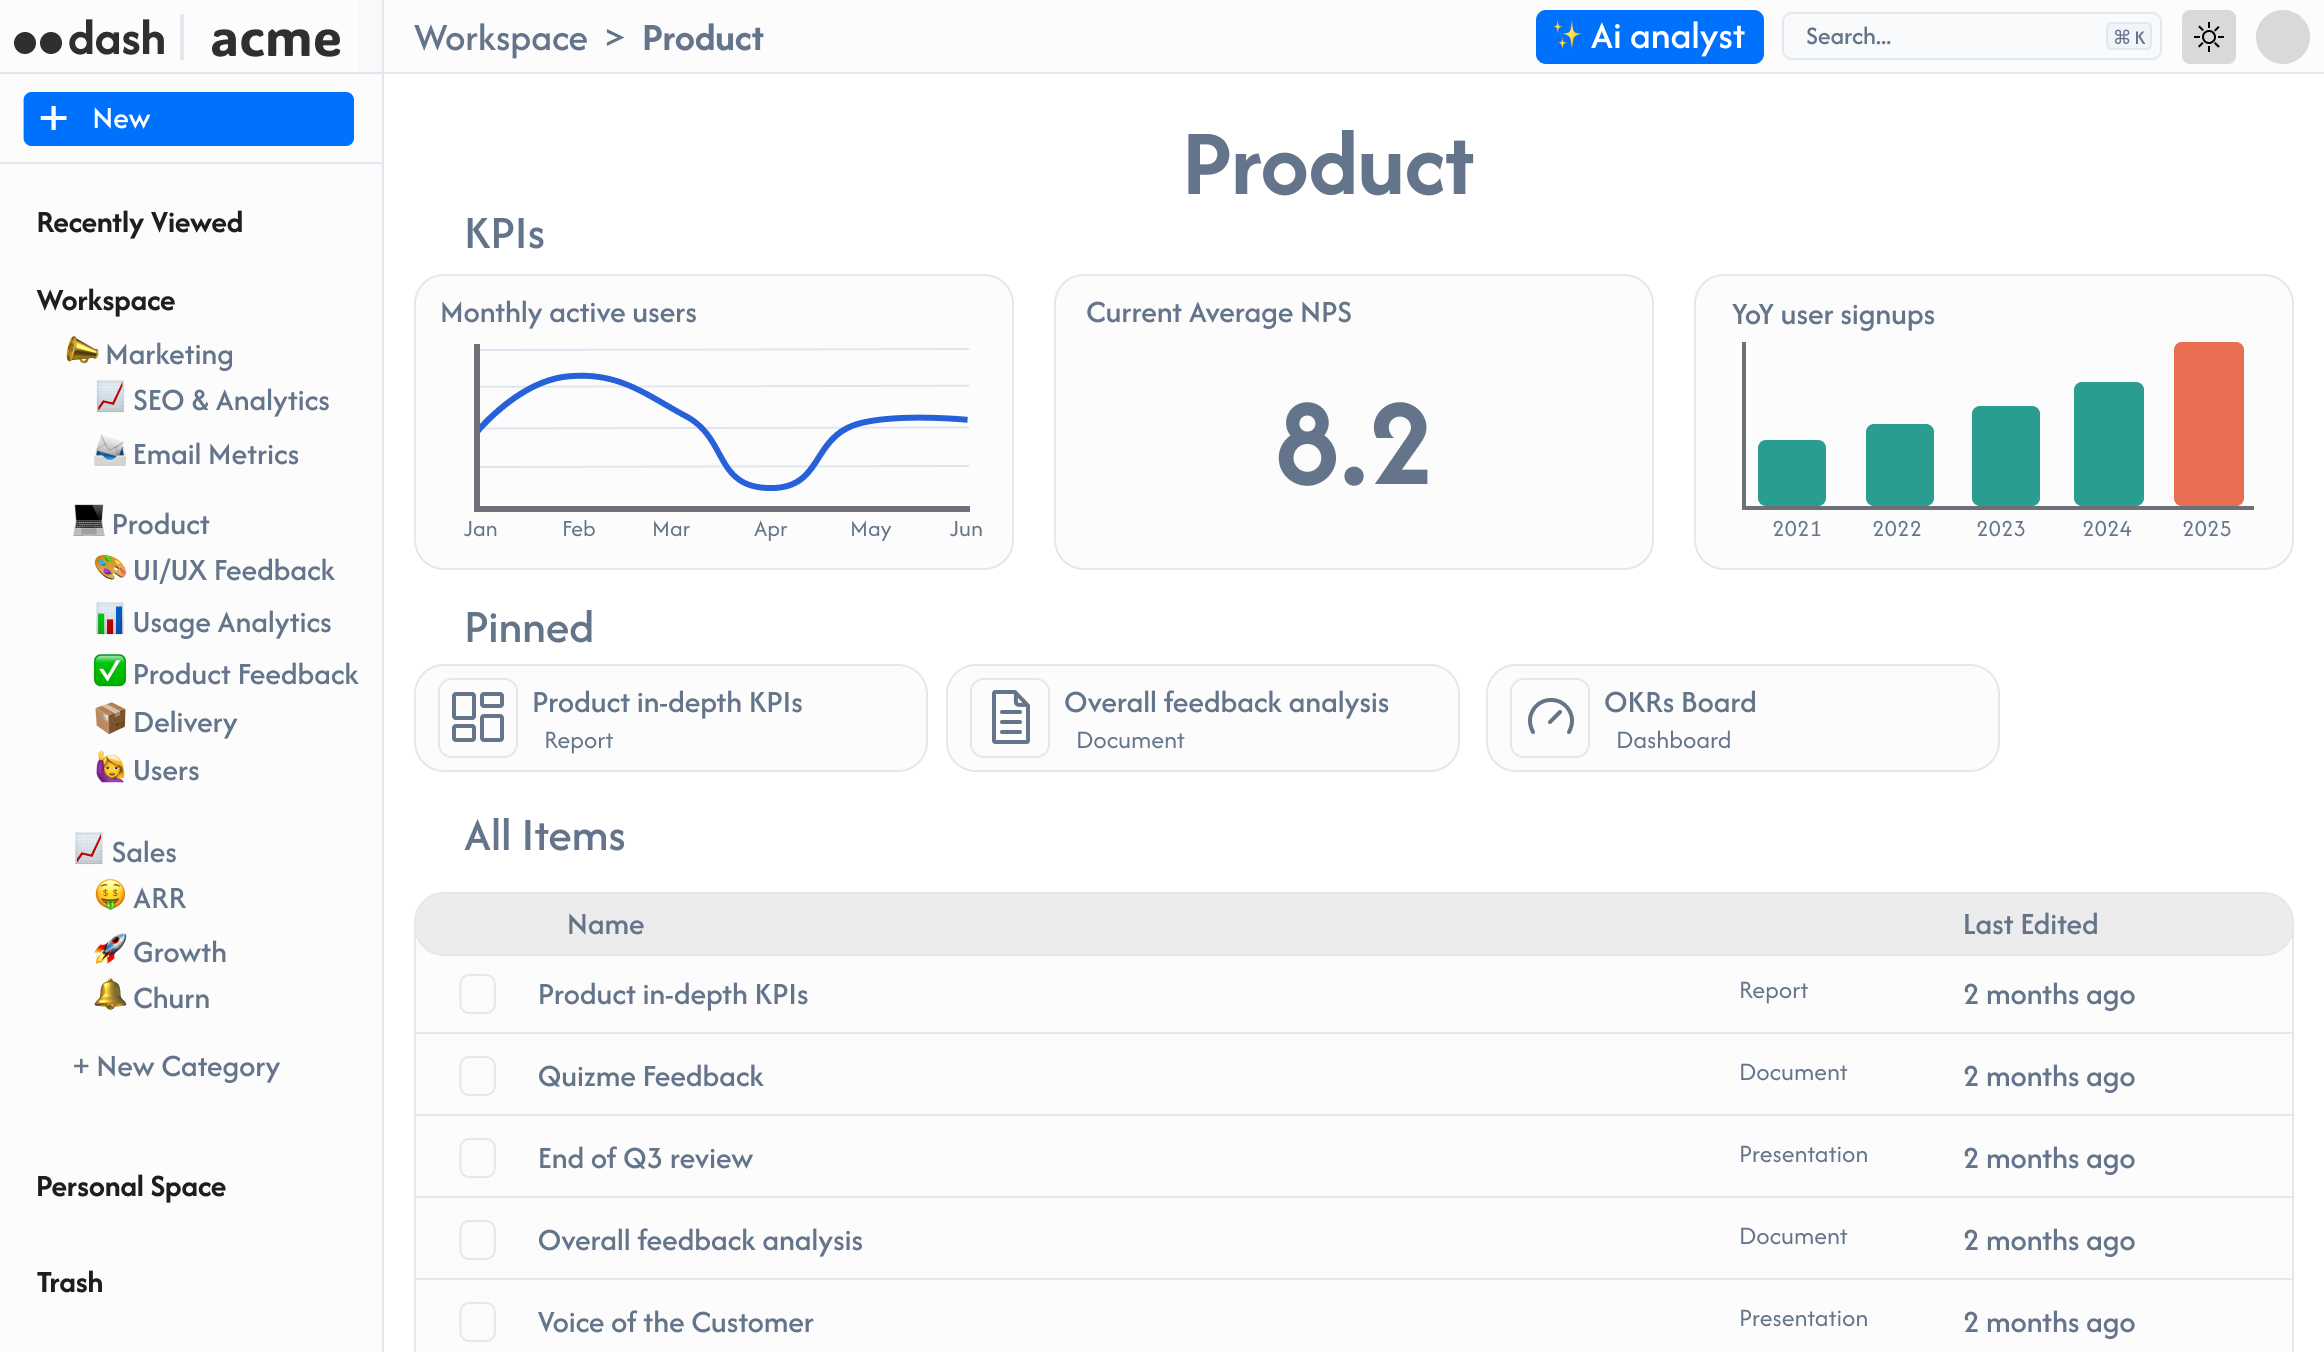
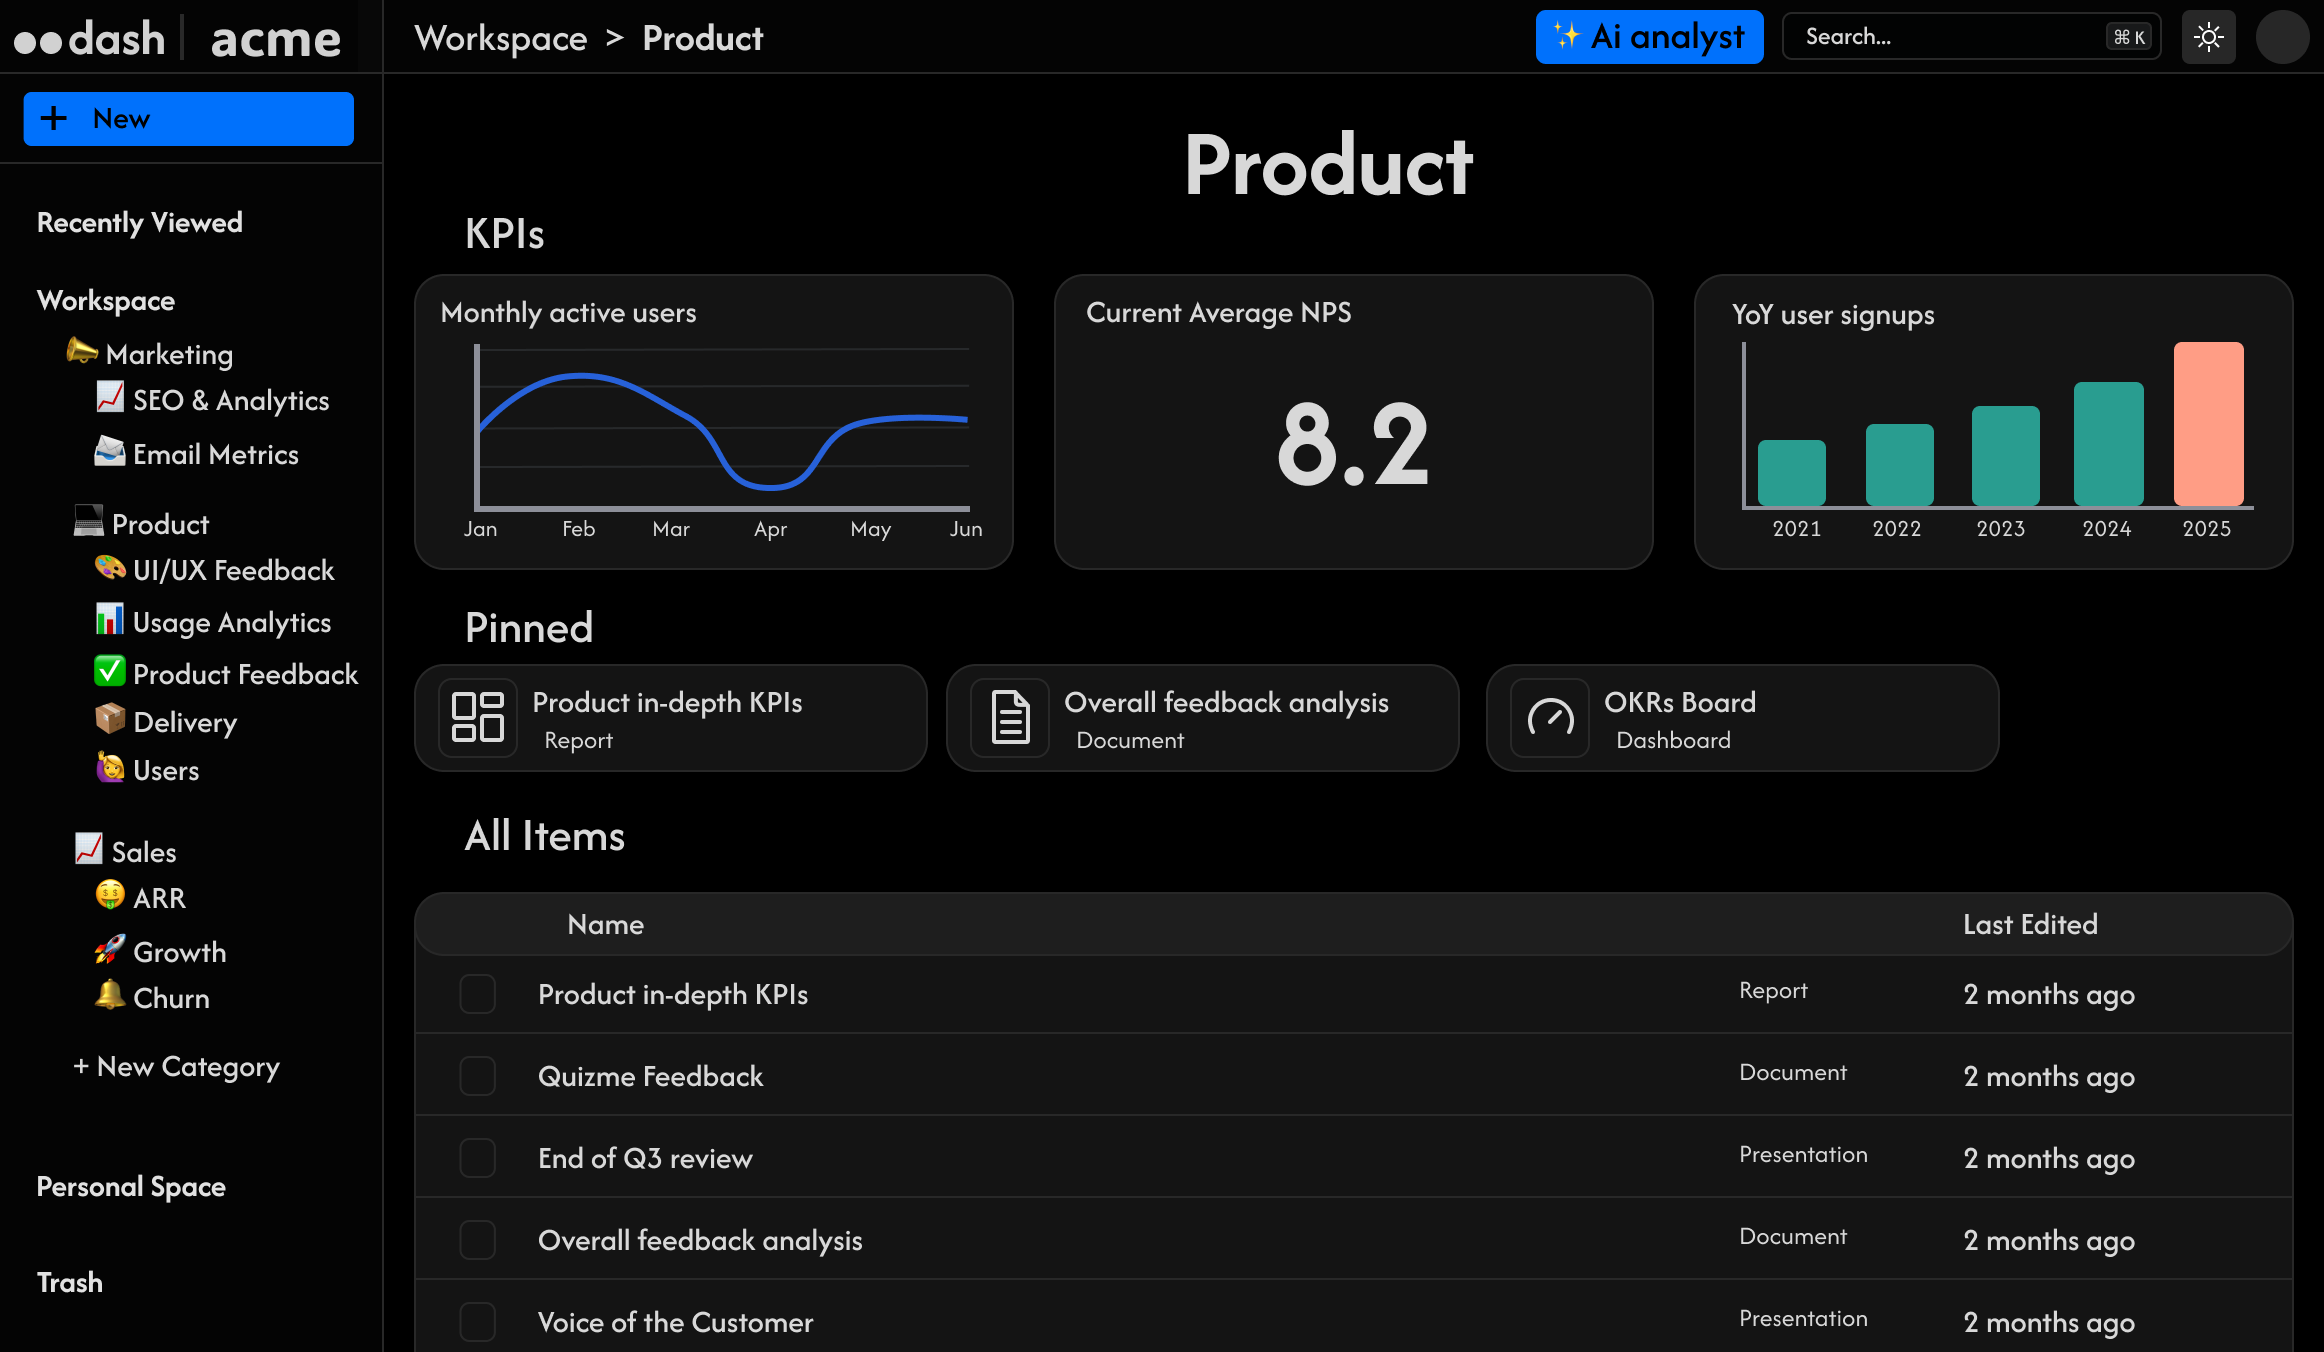
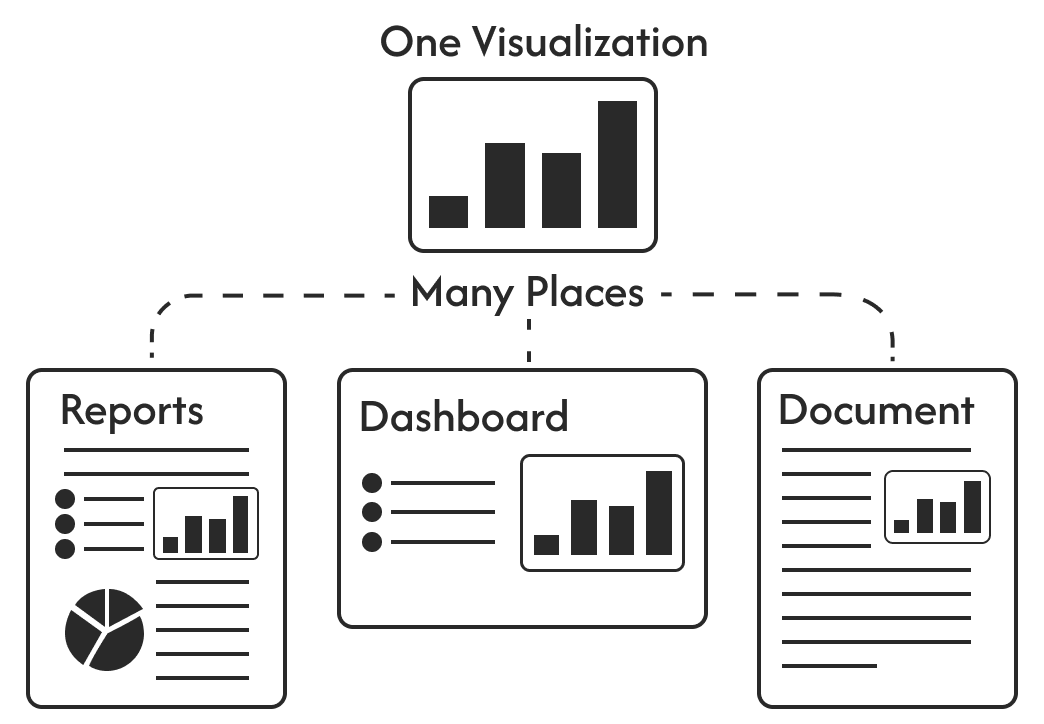
Versatile Visualizations
Create once, use everywhere – dashboards, reports, documents, and presentations.
AI-Powered Assistance
Let our AI data analysts do the heavy lifting for you.
Semantic Layer Support
Native integration with cube dev, dbt metrics and metricsflow for seamless data modeling.
Built For Speed
With our advanced caching system, you can generate visualizations in seconds.
Features That Set Us Apart
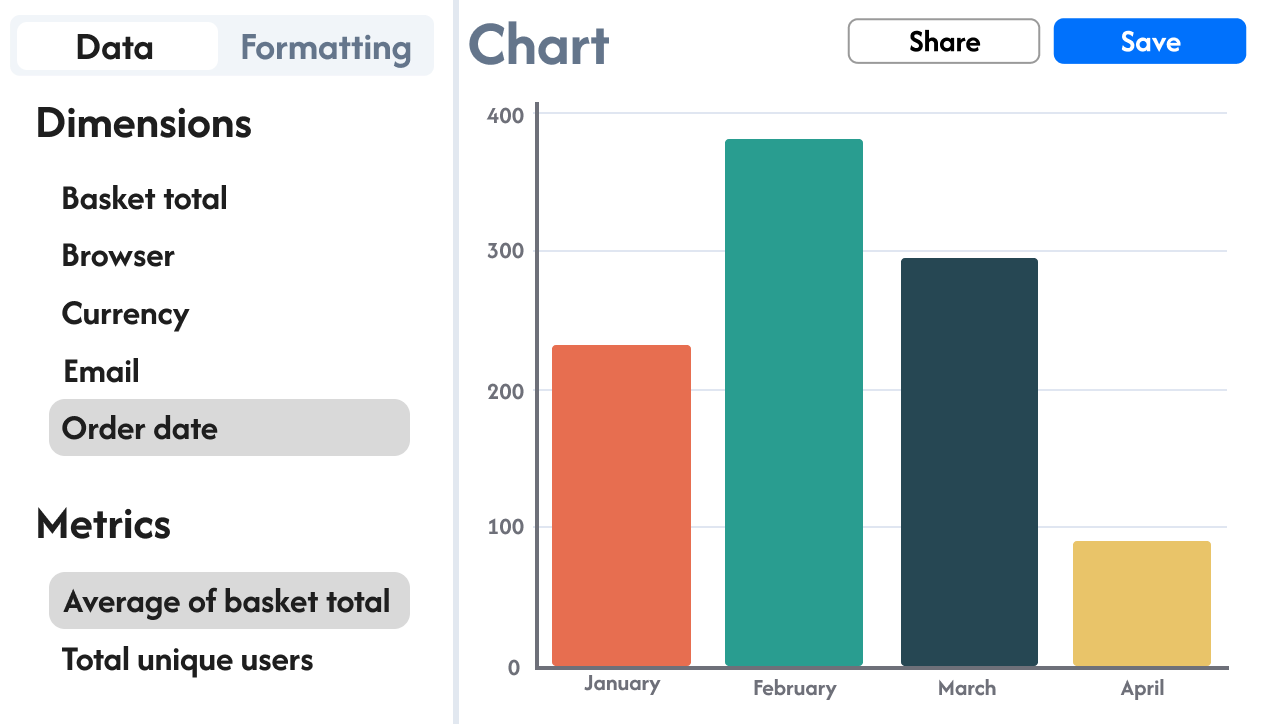
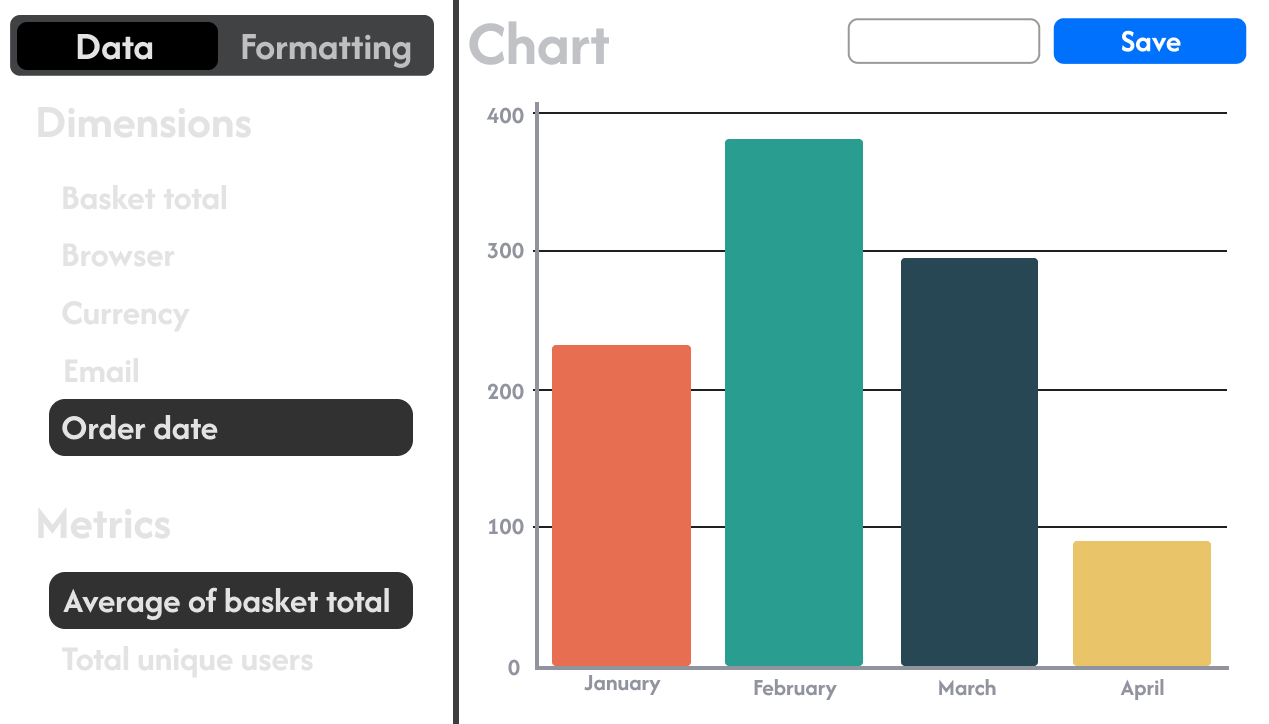
🚀 Self-Service for All
Intuitive interface designed for both data novices and experts. Drag, drop, and discover insights without writing a single line of code.
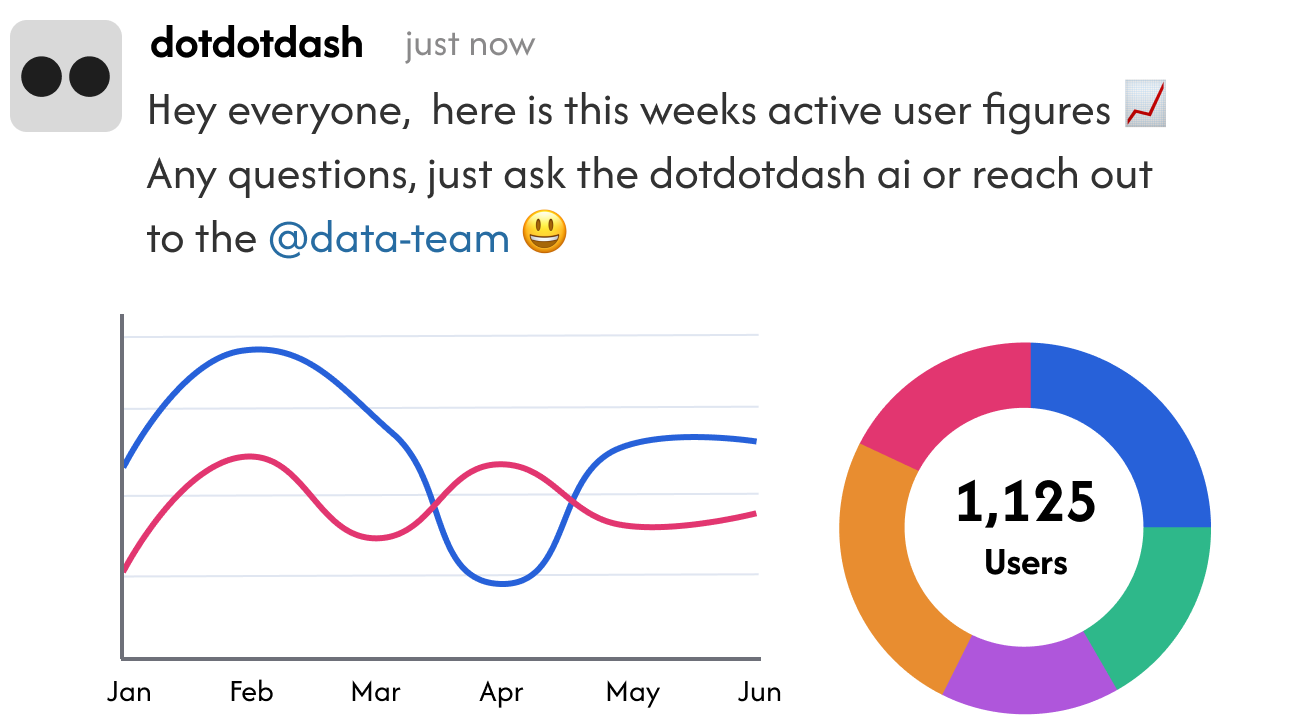
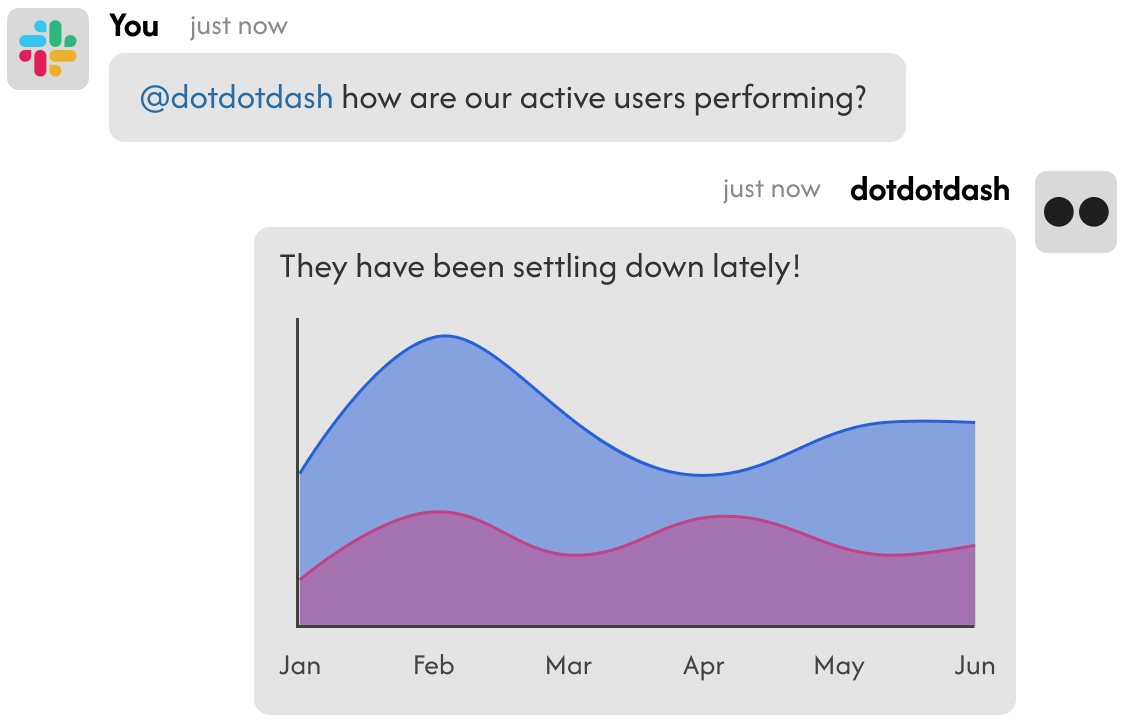
🔗 Share and Collaborate
Create and share visualizations across your organization. Foster a data-driven culture where insights are accessible to all.
📊 Unified Visualizations
Design once, use everywhere: dynamic BI dashboards, comprehensive data reports, engaging slide presentations, and rich long-form data documents.

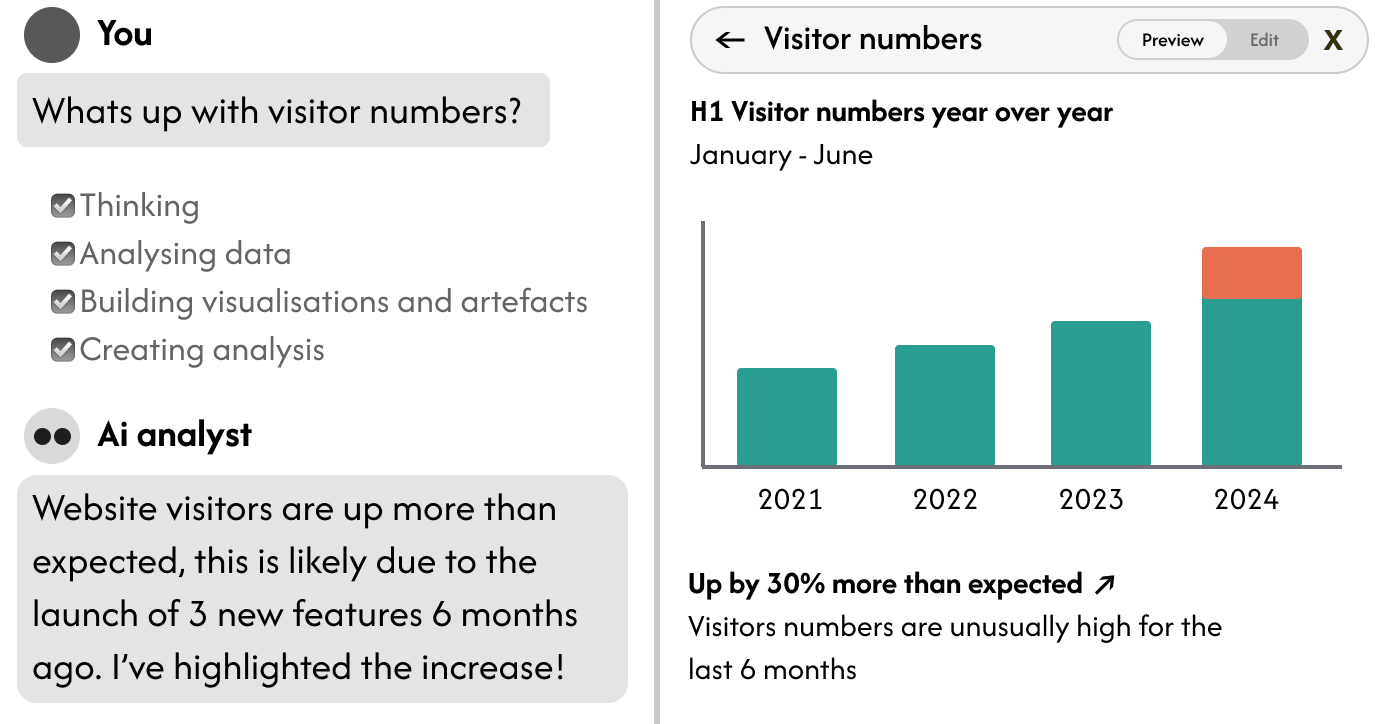
🤖 AI-Assisted Analysis
Our AI data analysts are at your service: automatically generate visualizations, build custom dashboards,cCreate detailed reports and presentations, Uncover hidden trends and patterns.
🧠 Powerful Semantic Layer
Leverage the strength of open-source data modeling: Native support for dbt metrics, seamless integration with metricsflow. Create a single source of truth for your entire organization.
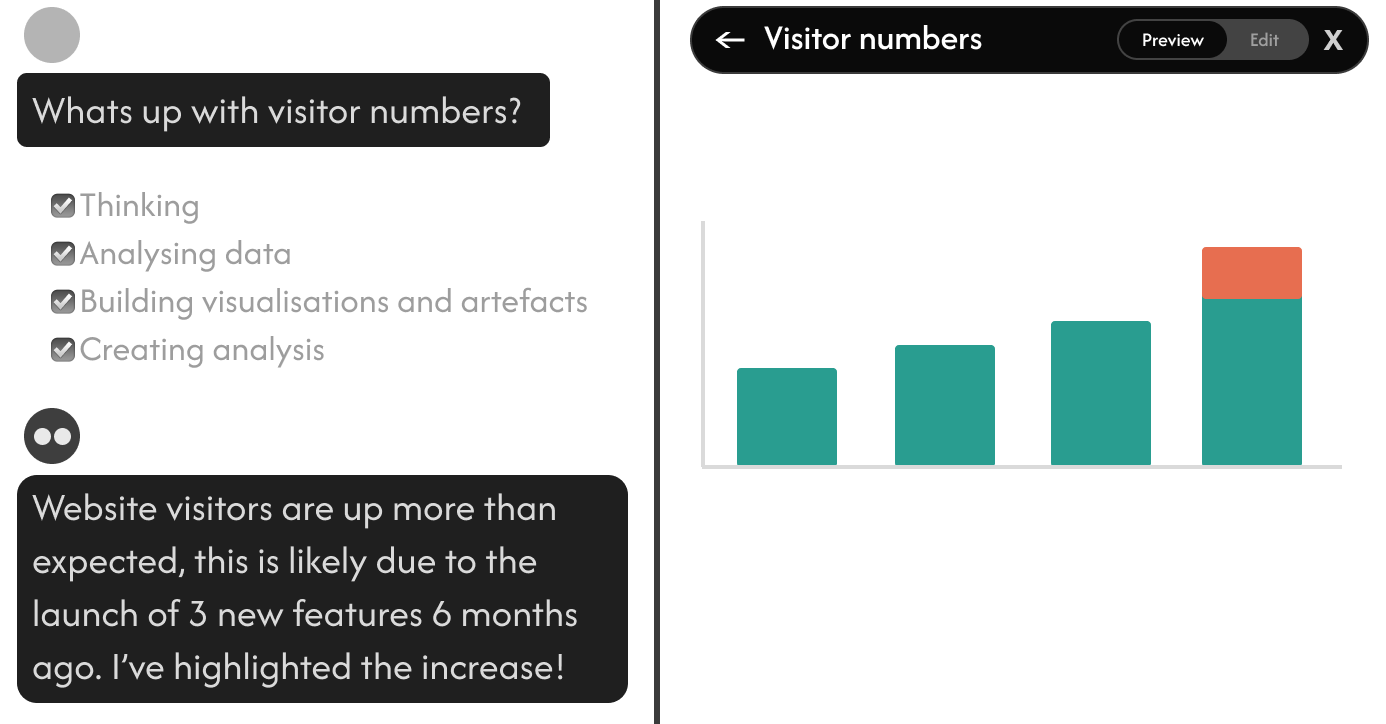
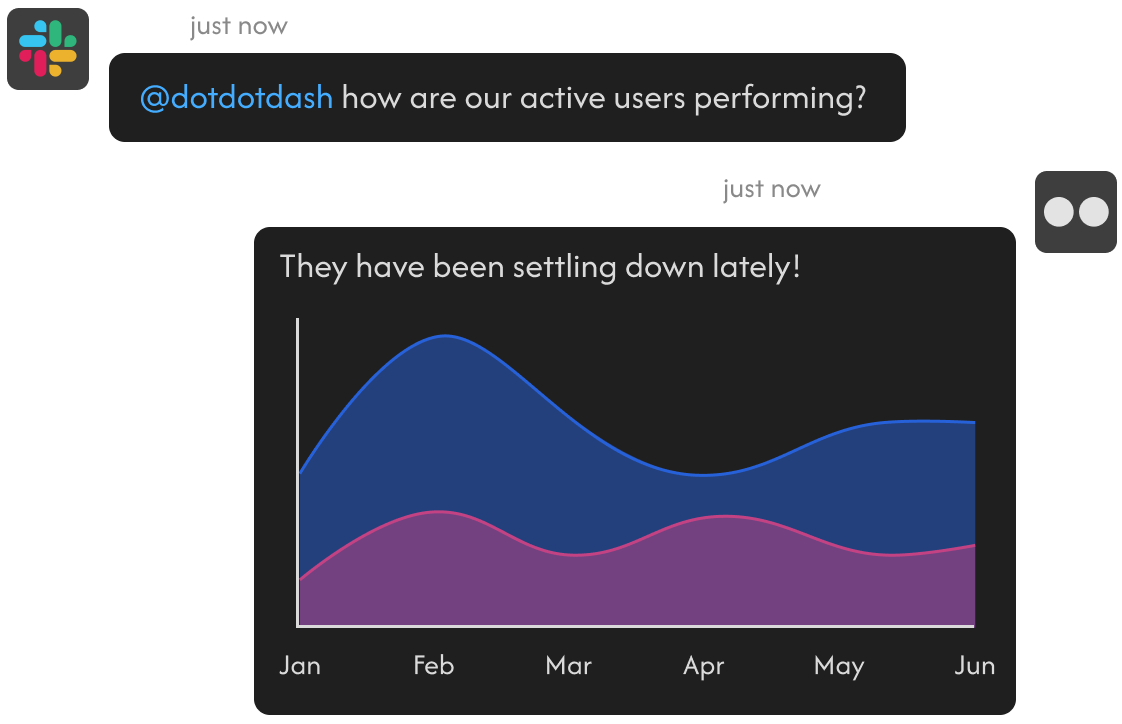
💬 Chat with Your Data
Ask questions in natural language and get instant insights. Data analysis has never been more conversational.
Experience the Future of BI Today
dot dot dash is more than just a tool – it's your partner in data-driven decision making. Whether you're a seasoned data scientist or a business user looking for quick insights, dot dot dash adapts to your needs.